Climate Matters•April 17, 2024
Earth Day: Fastest-Warming Cities and Record Clean Investment
KEY CONCEPTS
All 50 states and 237 U.S. cities (98% of 241 analyzed) have warmed since the first Earth Day in 1970.
Some 187 U.S. cities have warmed by at least 2°F since 1970. The fastest-warming city was Reno, Nevada and the fastest-warming state was Alaska.
Continued warming can harm people and ecosystems, but we have many options to cut carbon pollution and accelerate the clean energy transition.
Private and public U.S. investment in clean technologies like solar, wind, and battery storage has never been higher — more than tripling from 2018 to 2023.
South Carolina and Nevada led in clean investment in 2023, prioritizing battery manufacturing.
Continued heat-trapping pollution
Each year on April 22, Earth Day is an opportunity to celebrate progress and raise awareness around planetary-scale challenges — including climate change.
Concentrations of CO2, methane, and other heat-trapping gases in the atmosphere continued to climb in 2023 due mainly to continued burning of fossil fuels such as coal, oil, and methane (or natural gas).
Atmospheric CO2 and methane are now more than 50% and 160% higher, respectively, than pre-industrial levels.
Continued heat-trapping pollution causes global temperatures to rise and puts people and ecosystems at risk from more frequent and intense extreme weather events.
The annual average CO2 concentration measured at Mauna Loa, Hawaii was 421 ppm in 2023 — 29% higher than in 1970, the year of the first Earth Day.
How have temperatures across the U.S. changed since then as carbon pollution has continued to climb?
Warming since the first Earth Day
Climate Central analyzed average annual temperature trends in 241 U.S. cities, 49 states (see Methodology), and the entire nation since 1970, finding that:
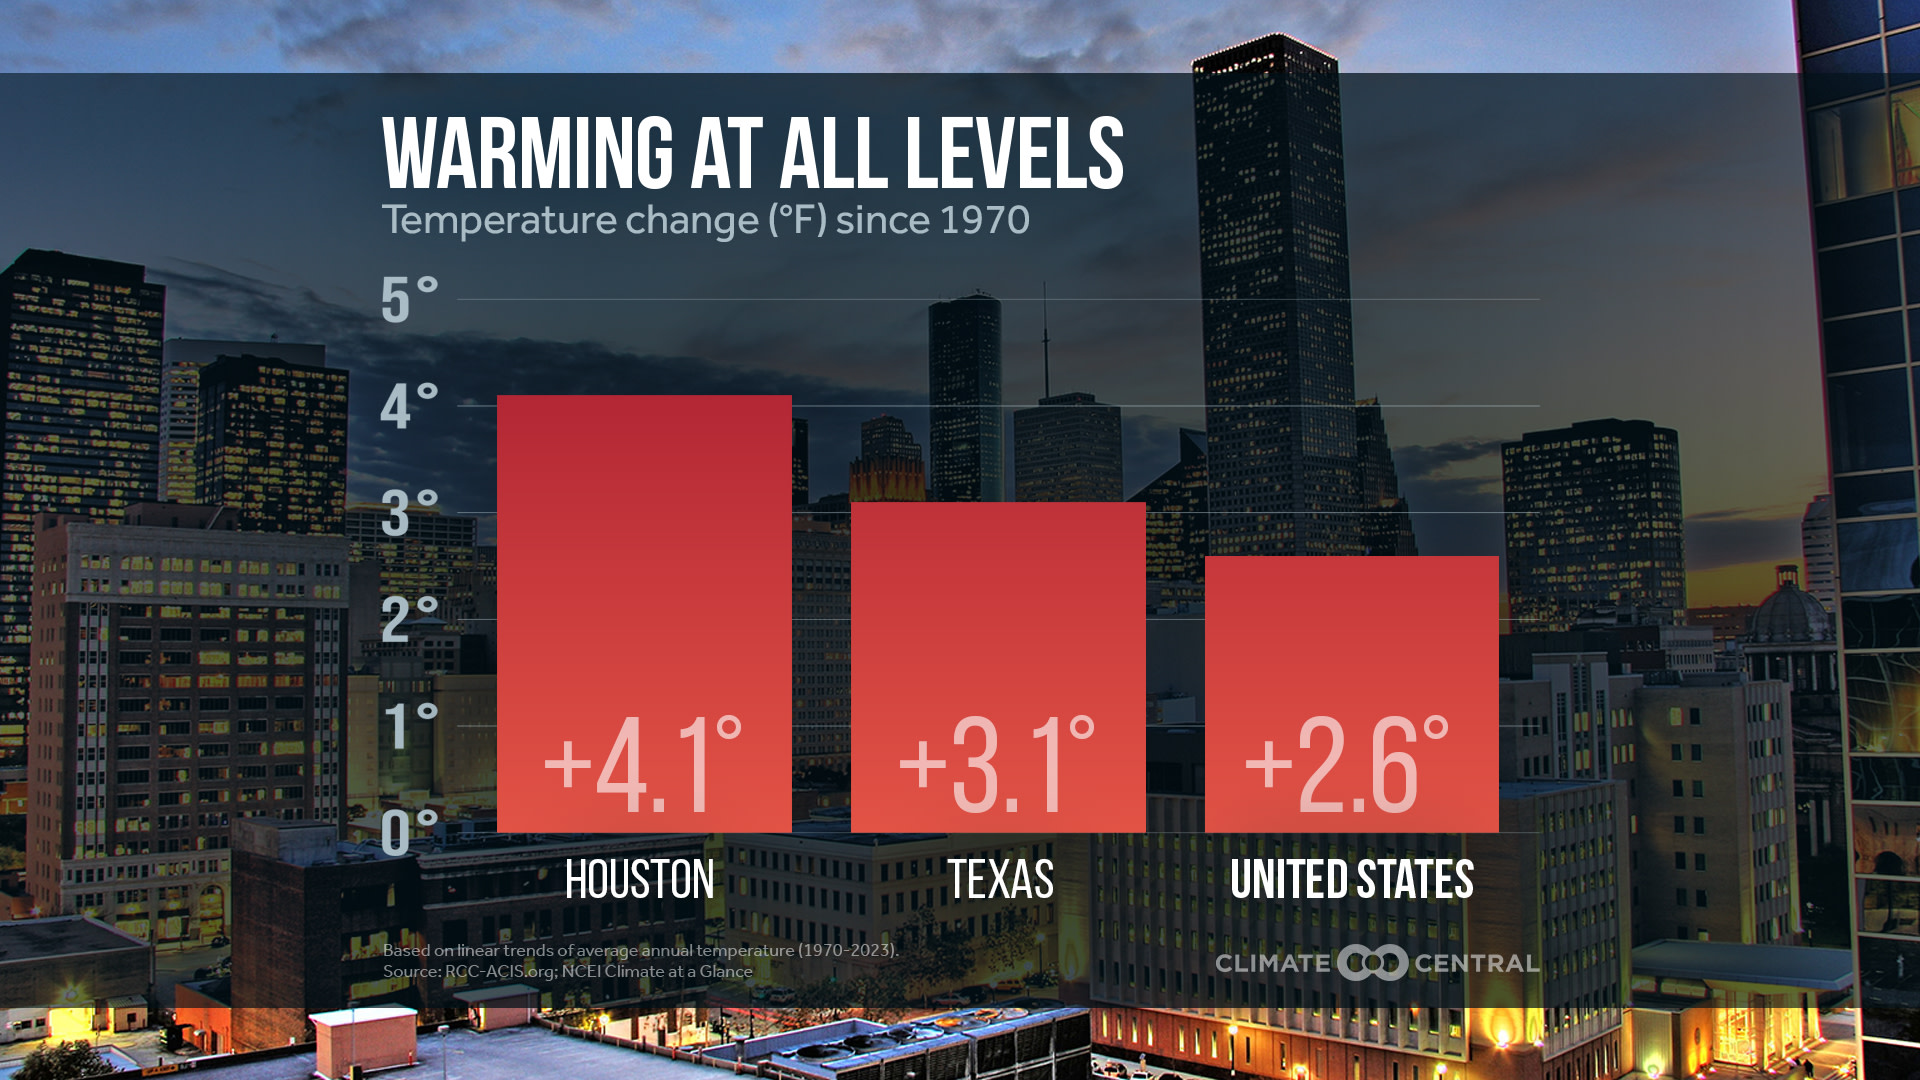
The contiguous U.S. is 2.6°F warmer today than it was in 1970, based on average temperatures.
This is very close to the long-term average global warming limit of 2.7°F (1.5°C) that 196 countries, including the U.S., have agreed to pursue.
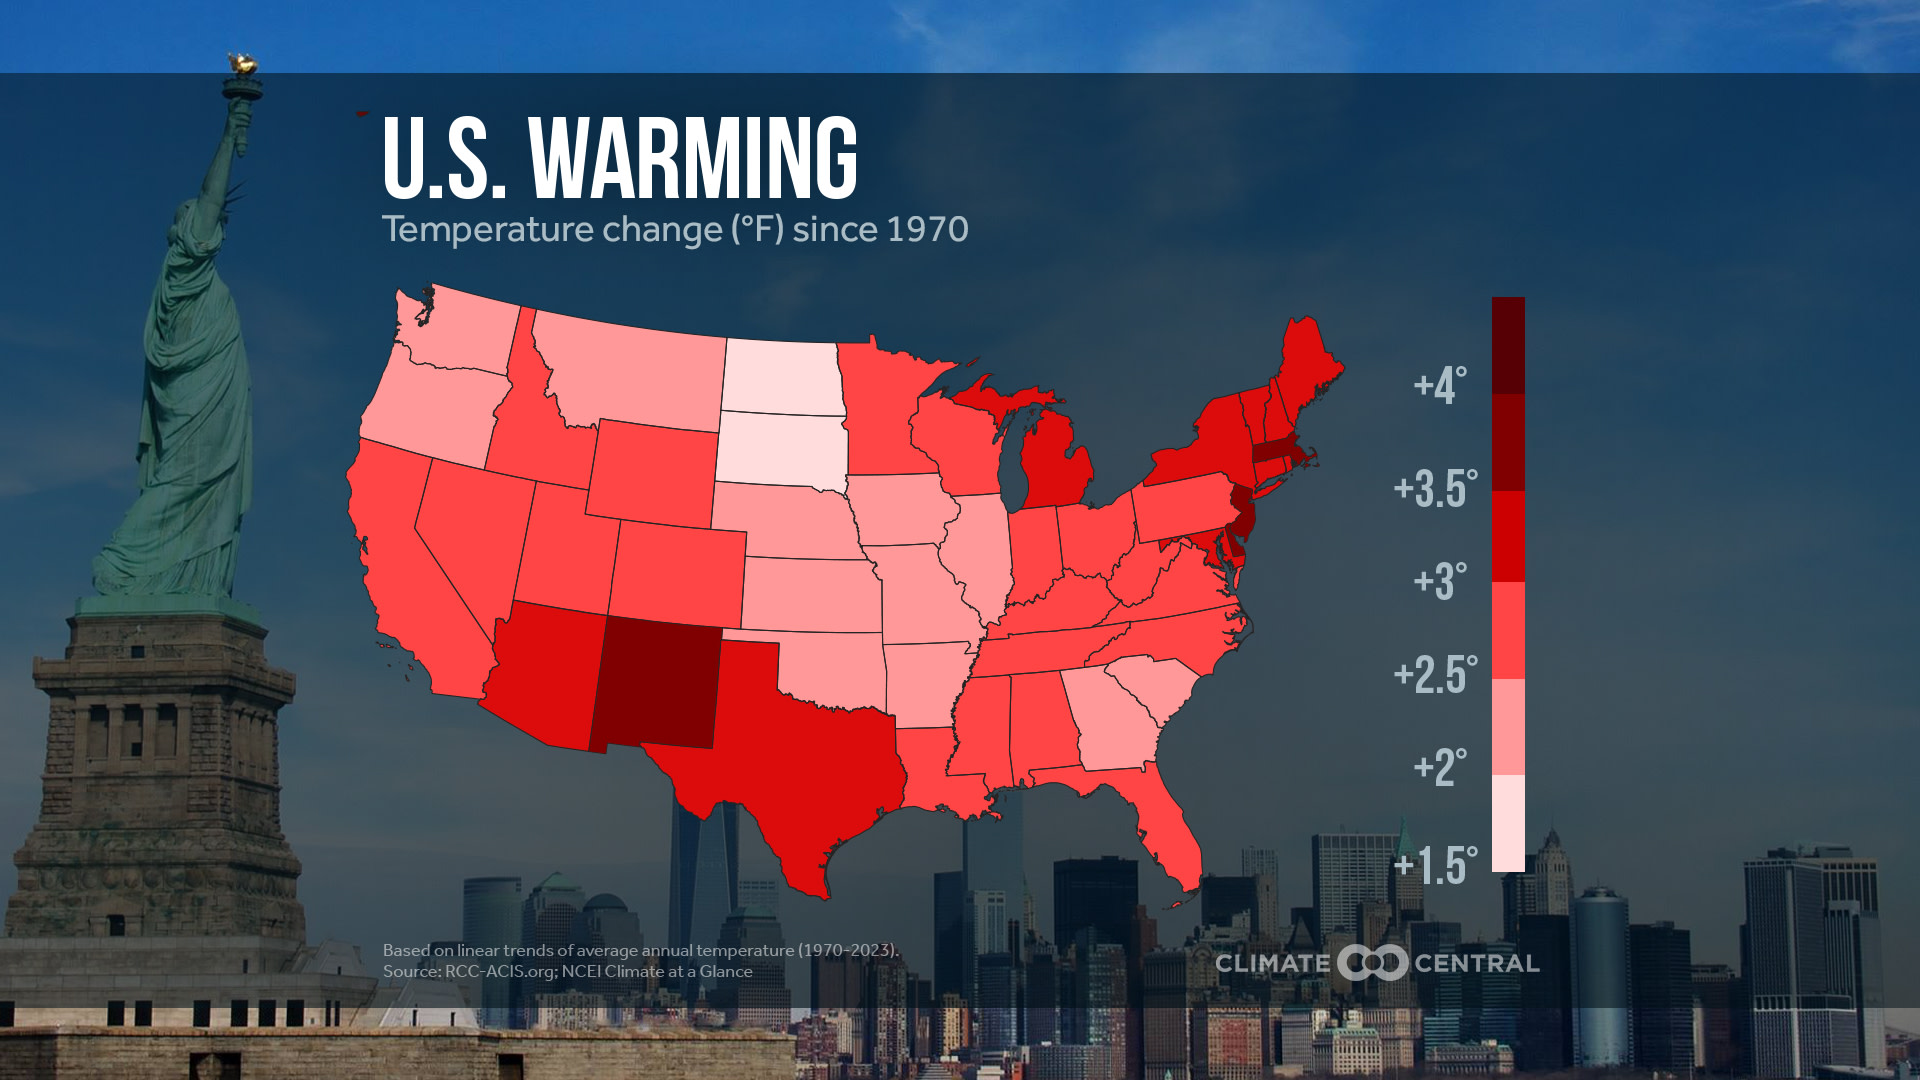
All 50 states have warmed since 1970.
The 49 states analyzed by Climate Central have warmed by 2.7°F on average since 1970.
Alaska was the fastest-warming state by far, due to its high latitude.
Hawaii is also warming. The latest NOAA State Climate Summaries found warming across the Hawaiian islands since 1950. Honolulu has warmed 2.6°F since 1950; since 1975, the city has consistently been above the 1951–1980 average.
Some 237 U.S. cities (98% of 241 analyzed) have warmed since 1970.
Some 187 cities (78% of 241 analyzed) have experienced at least 2°F of warming.
Many of the fastest-warming locations were in the Southwest — a region vulnerable to droughts and heat extremes, which are likely to worsen with climate change.
Fastest-warming cities and states
Based on the increase in annual average temperature from 1970 to 2023:
Fastest-warming cities (°F) | Fastest-warming states (°F) |
Reno, Nev. (+7.6°) | Alaska (+4.3°) |
Las Vegas, Nev. (+5.7°) | Delaware (+3.6°) |
El Paso, Texas (+5.4°) | Massachusetts (+3.5°) |
Albany, Ga. (+5°) | New Jersey (+3.5°) |
Burlington, Vt. (+4.9°) | New Mexico (+3.5°) |
U.S. climate action
If these pollution and warming trends continue, people and ecosystems will face increasing risks. But we have many options to cut carbon pollution from energy, transportation, agriculture, and more.
Every tenth of a degree of avoided warming counts toward a safer future.
Warming Across Generations shows how much warming younger generations in 242 U.S. cities could experience over their lifetimes if carbon pollution either continues, or is cut rapidly.
The U.S. has set a national goal to reduce heat-trapping emissions 50% below 2005 levels by 2030. Although the U.S. has reduced emissions by about 1% per year since 2005, this pace is not fast enough to meet national targets by 2030.
Reaching these targets requires action at the state and local levels — as well as unprecedented levels of clean energy manufacturing and deployment.
Record investment in the clean energy transition
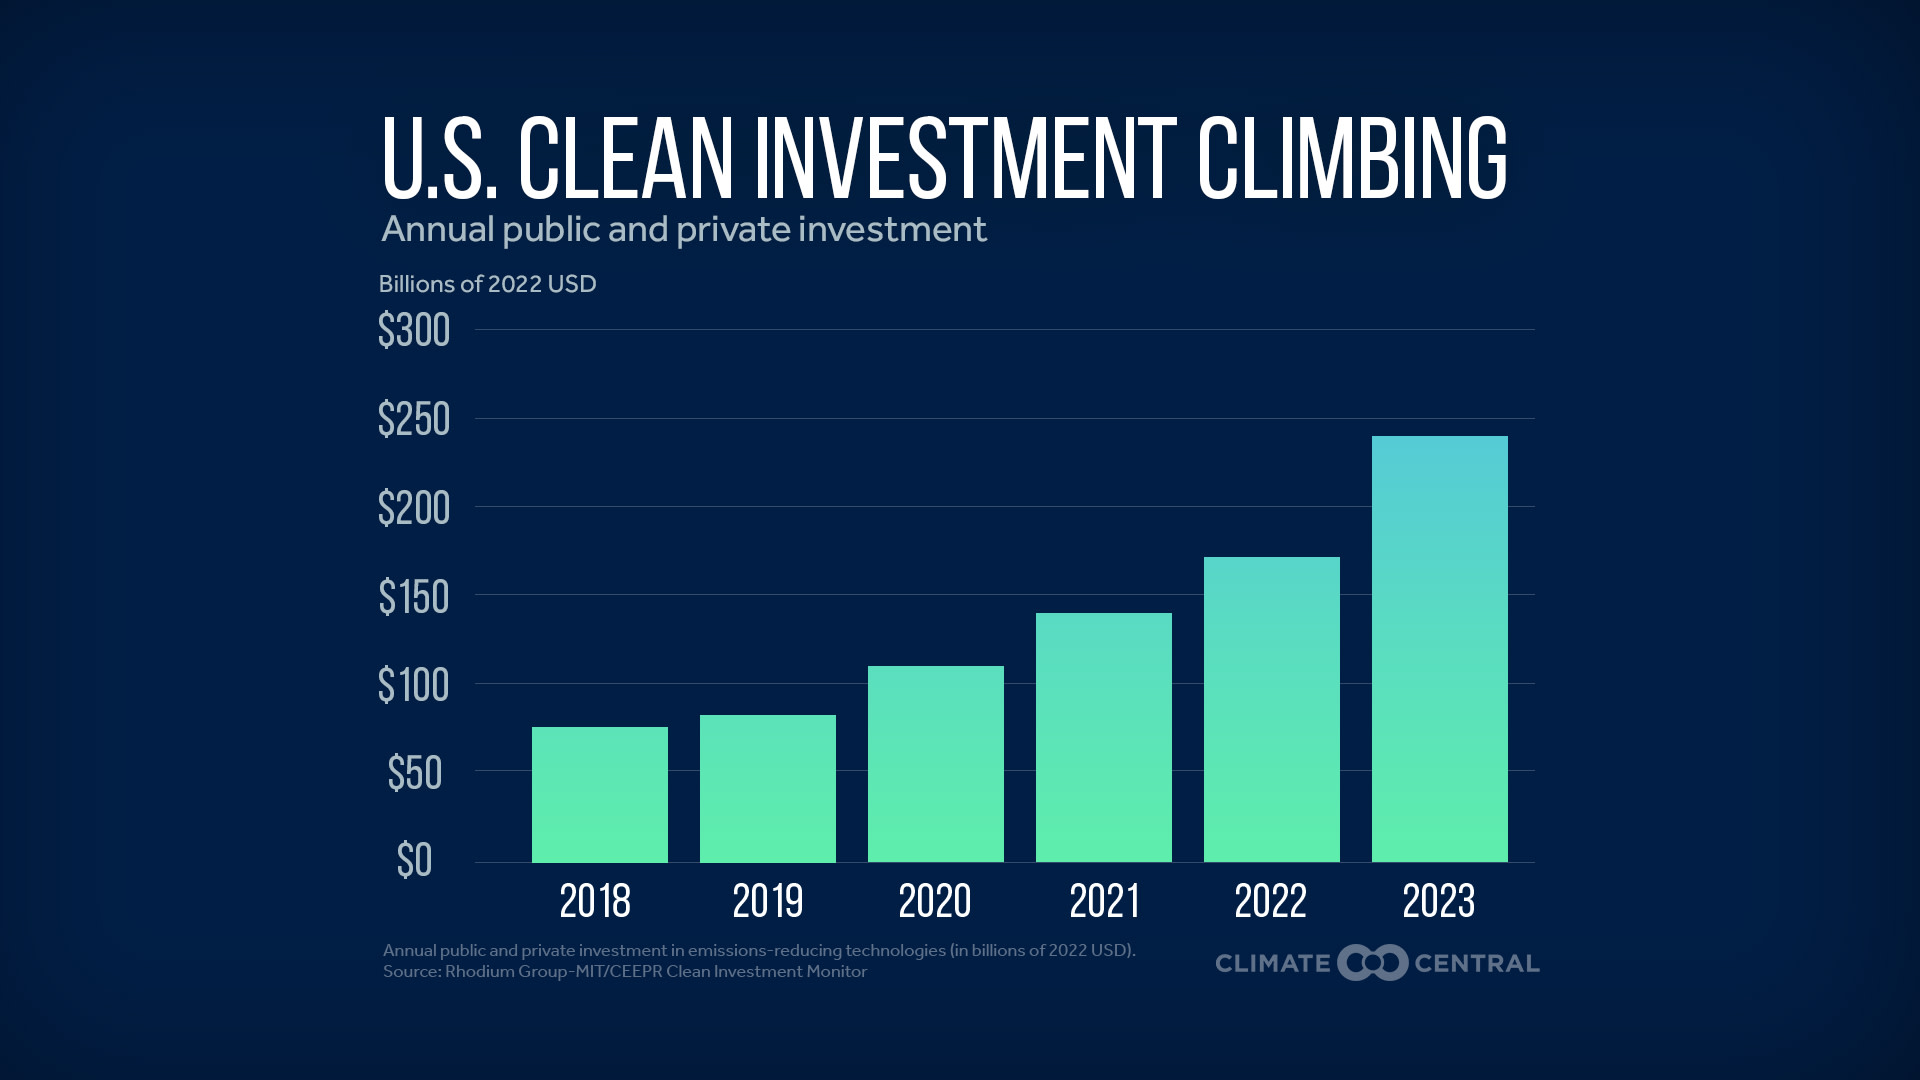
The good news is that investments in the clean energy transition have never been higher. At $239 billion, U.S. clean investment in 2023 was more than triple what it was in 2018 (adjusted for inflation). That’s according to the Clean Investment Monitor, a database from Rhodium Group and the Massachusetts Institute of Technology.
The Clean Investment Monitor tracks U.S. private and public investments in the manufacture and deployment of a set of emissions-reducing technologies that are eligible for benefits under the Inflation Reduction Act, including: solar and wind energy, battery storage, electric vehicles, critical minerals, nuclear energy, hydrogen, carbon management, and more.
Clean investment has been growing in the U.S. since 2018, and accelerating since the 2022 passage of the Inflation Reduction Act which offers incentives for investments in clean technologies. But reaching U.S. climate goals will require further acceleration.
Clean investment is an integral part of the nation’s strategy to mitigate climate change. While clean investment dollars are not directly linked to emissions reductions, these investments have the potential to accelerate the clean energy transition by making clean technologies more available and affordable.
Leading states for clean investment
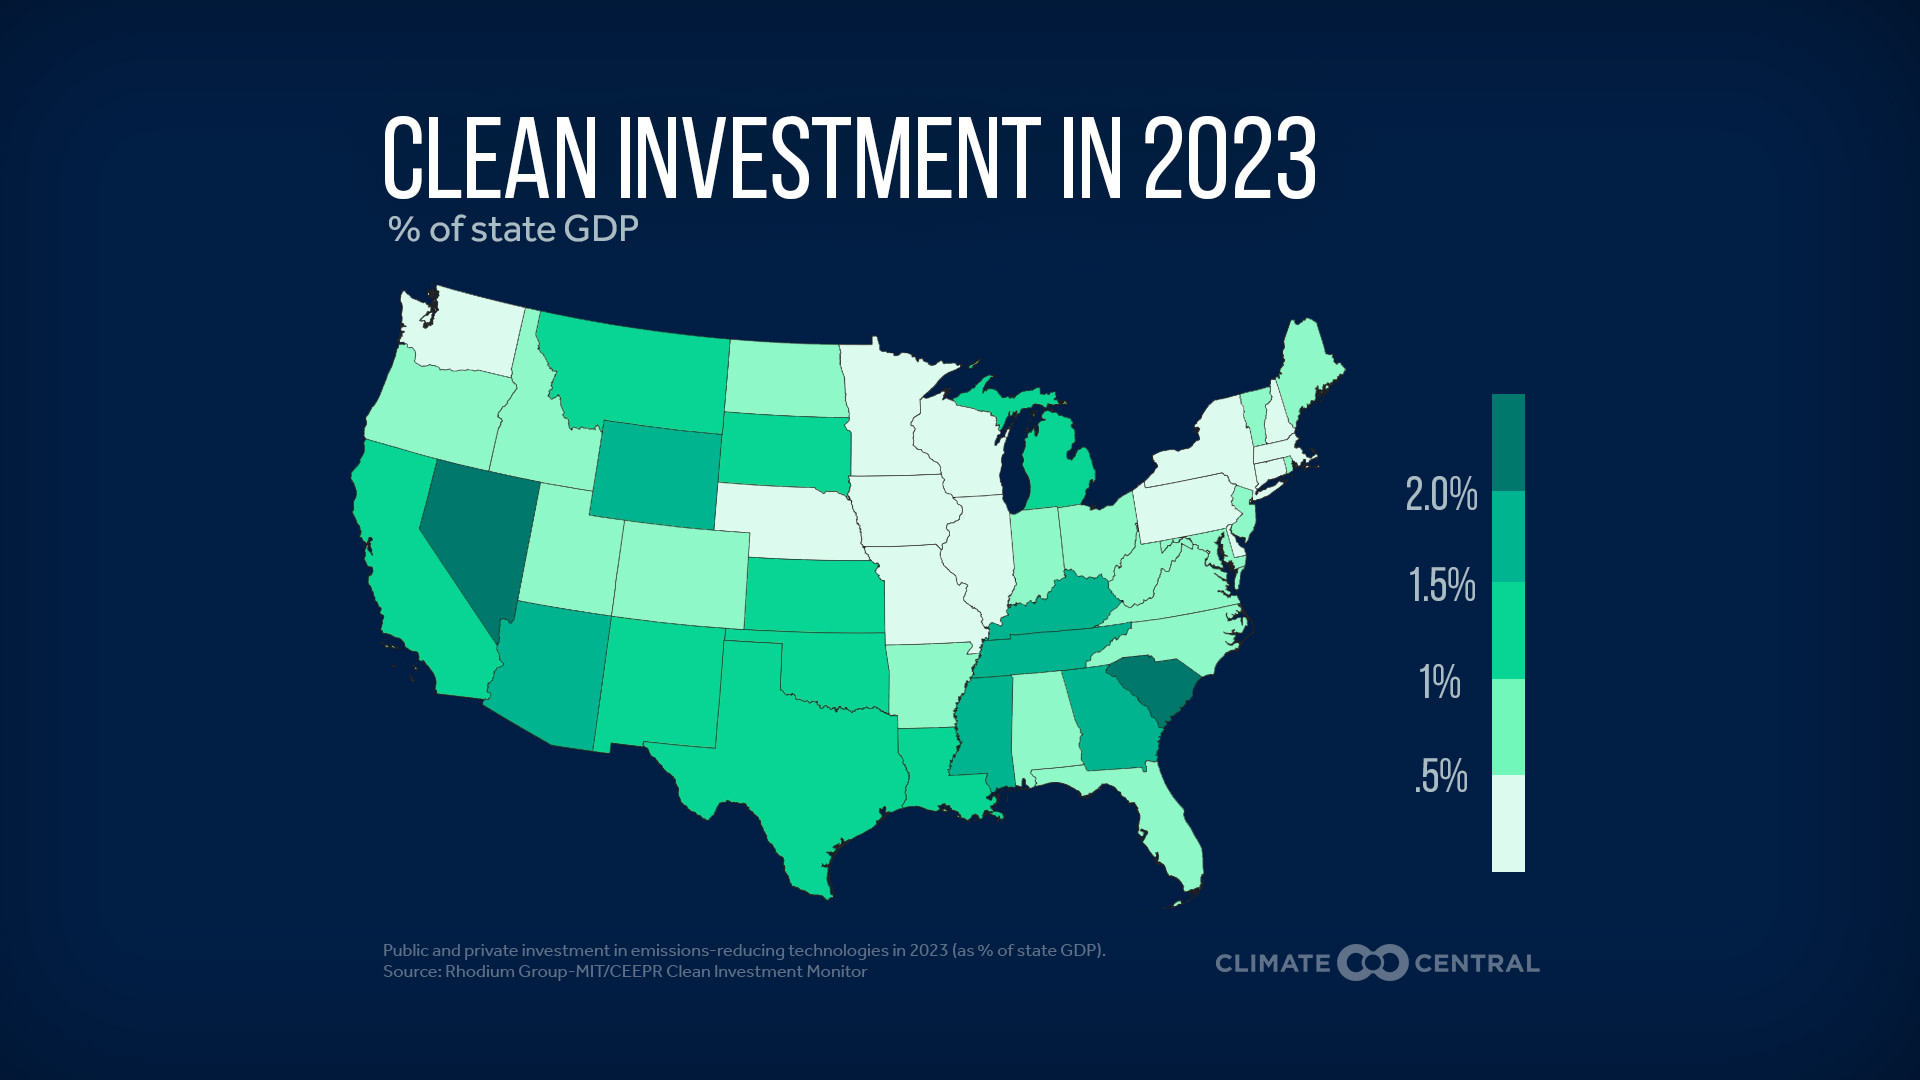
Clean investment has occurred at different levels across U.S. states, with each state prioritizing different technologies.
In 2023, South Carolina and Nevada led in clean investment as a percentage of state GDP, with battery manufacturing receiving the highest levels of investment in both states.
Top 10 states for clean investment in 2023:
State | Clean investment in 2023 (% GDP) | Leading technology (within leading segment) |
South Carolina | 2.2% | Batteries (manufacturing) |
Nevada | 2.1% | Batteries (manufacturing) |
Wyoming | 1.7% | Wind (deployment) |
Tennessee | 1.7% | Batteries (manufacturing) |
Georgia | 1.5% | Batteries (manufacturing) |
Mississippi | 1.5% | Solar (deployment) |
Arizona | 1.5% | Zero-Emission Vehicles (retail) |
Kentucky | 1.5% | Batteries (manufacturing) |
Kansas | 1.4% | Batteries (manufacturing) |
Montana | 1.4% | Wind (deployment) |
Battery manufacturing led clean investment in six of the top 10 states for clean investment in 2023: South Carolina, Nevada, Tennessee, Georgia, Kentucky, and Kansas.
Rapid growth in wind and solar capacity across the U.S. is linked to growing battery manufacturing. These batteries store excess power during periods of low demand and release power when electricity demand is high. The U.S. Energy Information Administration projects a near doubling of U.S. battery storage capacity in 2024.
LOCAL STORY ANGLES
Three ways to cover climate solutions in your state:
A Decade of U.S. Solar Growth and A Decade of U.S. Wind Growth shows that the U.S. produced enough solar and wind power in 2023 to power 61 million homes — reflecting a 10-year growth curve in both technologies at the state and national levels.
State Solar and Wind Boom to Bring U.S. Toward Climate Targets shows that, by 2035, solar and wind are expected to make up more than 50% of energy capacity in 46 states under current policies.
Climate Solutions in Every State reviews options to quickly reduce emissions in each U.S. state’s top-emitting sector.
Check your state’s official climate goals and progress.
Is yours among the 22 states with official clean energy goals, the 24 states in the U.S. Climate Alliance, or the 33 states with Climate Action Plans? Search State Climate Policy Maps or the Database of State Incentives for Renewables & Efficiency for the status of climate action in all 50 states. State Climate Scorecards track each state’s progress toward official climate goals, broken out by sector.
CONTACT EXPERTS
Michael Delgado (he/him/his)
Director, Energy and Climate
Rhodium Group
Relevant expertise: U.S. clean investment tracking; climate change science, economics, and policy
Contact: mdelgado@rhg.com
Hannah Hess (she/her/hers)
Associate Director, Rhodium Group
Relevant expertise: U.S. clean investment tracking; climate change science, economics, and policy
Contact: hhess@rhg.com
FIND EXPERTS
Submit a request to SciLine from the American Association for the Advancement of Science or to the Climate Data Concierge from Columbia University. These free services rapidly connect journalists to relevant scientific experts.
Browse maps of climate experts and services at regional NOAA, USDA, and Department of the Interior offices.
Explore databases such as 500 Women Scientists, BIPOC Climate and Energy Justice PhDs, and Diverse Sources to find and amplify diverse expert voices.
Reach out to your State Climate Office or the nearest Land-Grant University to connect with scientists, educators, and extension staff in your local area.
METHODOLOGY
Annual average temperature data (1970-2023) were obtained from the Applied Climate Information System for 247 U.S. weather stations. State and contiguous U.S. temperature data were obtained from NOAA/NCEI’s Climate at a Glance. Trends for Hawaii and Puerto Rico were not calculated because they are not included in the NOAA/NCEI dataset.
Reported long-term trends (1970-2023) in annual average temperature are based on linear regression. Summary statistics were reported for 241 of the 247 stations due to data completeness issues for six stations: Dothan, Ala.; Hattiesburg, Miss.; Hazard, Ky.; Jefferson City, Mo.; Twin Falls, Idaho; and Wheeling, W.Va.